
Blog Synopsis: The advanced solutions of React Native are quite evident in its widespread community. Alongside the list of various React Native charts library also enhances the performance of such cross-platform solutions. You can utilize any of them to make your app deliver a better user experience. Thinking about how a chart library can enhance the performance of an app! Stay tuned to dive into the top 12 best React native chart libraries to make your app visually appealing.
For any data representation, Graphs and charts are the best and sorted solutions. It is useful for displaying statistical data gained from the databases meaningfully. Likewise, the cross-platform React Native framework has many open-source libraries helping to portray data in graphs and charts. Knowing which react native chart library is critical for data visualization. Also, it is a necessary first step of your React Native app development data visualization process.
The charts like pie charts, infographics charts, pie charts, and many more can sometimes confuse you. Although, there are innumerable ways of data representation with React native libraries it sometimes can be daunting to pick the ideal one. So, you may face such a challenging situation for your React native app, but this blog will guide you.
Top 12 React Native Chart Libraries That You Should Opt
1. Recharts
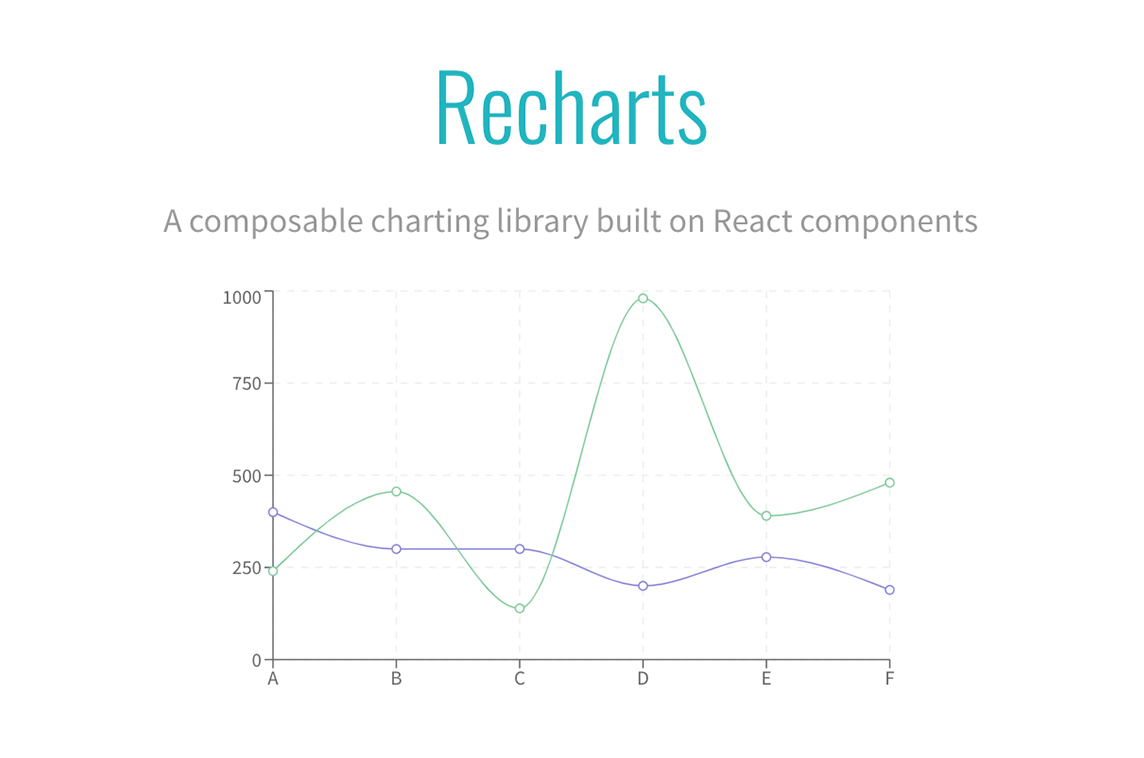
The first and foremost react native graph library is Recharts. It is an old yet reliable chart library for React applications. The library features the support of native SVG with D3 sub-modules light dependency. It utilizes declarative components with chart components that are purely presentational. With a 15.1K star rating on GitHub, recharts is the library to look for data visualization libraries for React apps. It boasts 481K npm downloads every week.
2. Victory
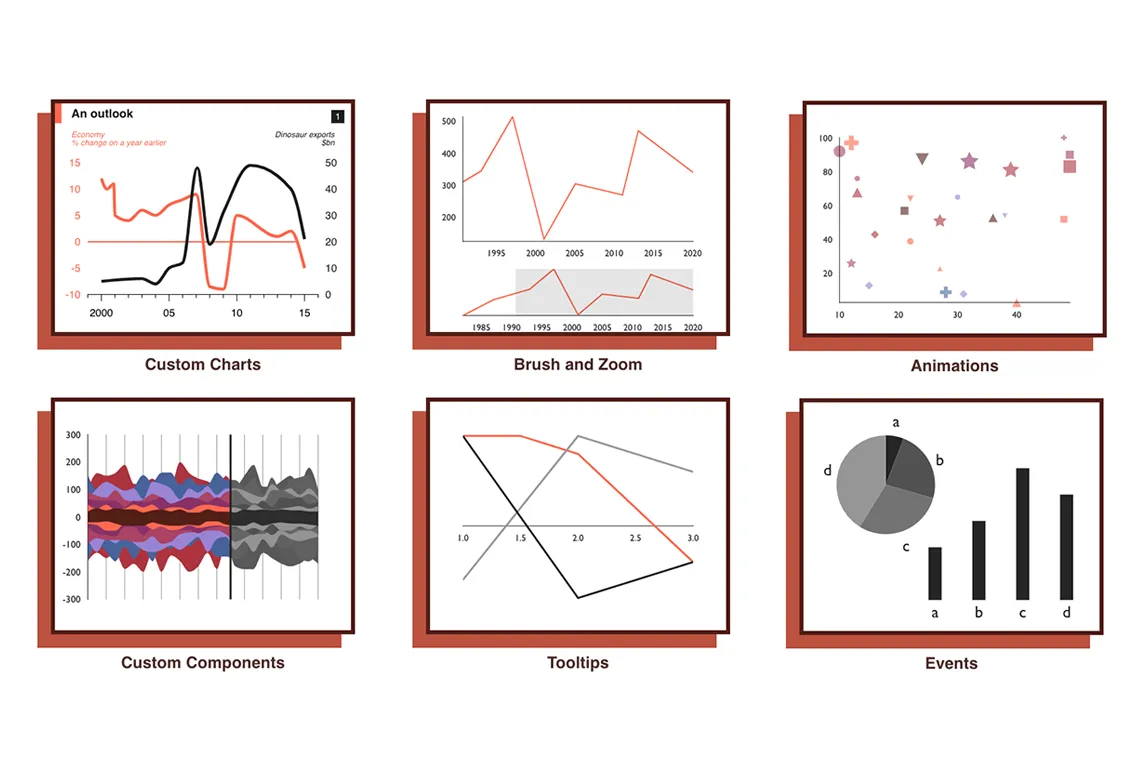
This is a complete set of components with modular charting that is suitable for React Native. When you hire a React Native developer, the individual can leverage the library for cross-platform charting. It is simple to use and learn. Victory is flexible and allows quick integration of bar, line, candlestick, and pie charts in the apps.
A reason for its rapid popularity is that it is a library produced by Formidable, a reputed company employing proficient designers and developers across the globe. Victory has over 8.4K stars on GitHub and has a weekly 141K download rate.
3. react-chartjs-2
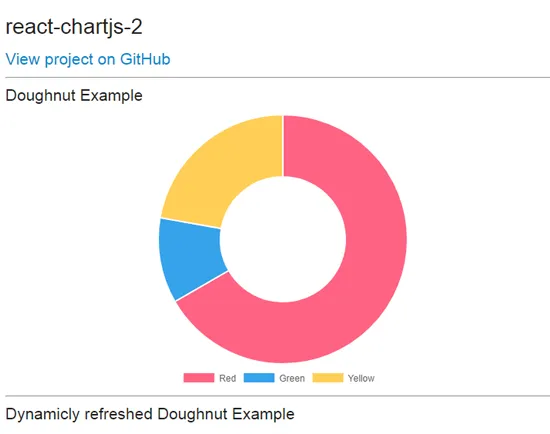
The library is not much of a React chart library but is a popular React wrapper and a library for JavaScript-based charts. Chart.js is quite lightweight and builds responsive components through the elements of HTML5 Canvas. It provides six chart styles and is quite beginner-friendly. It is widely used in Vue.js and React, with each containing its library. This library is a great wrapper, but most of its documentation needs referencing from Chart.js. Thankfully, it has a community and thorough support, which is remarkable. The react-chartjs-2 has a rating of 3.4K stars and 298K node package manager downloads weekly.
Must Read: Things To Consider When Creating A React Native App
4. Nivo
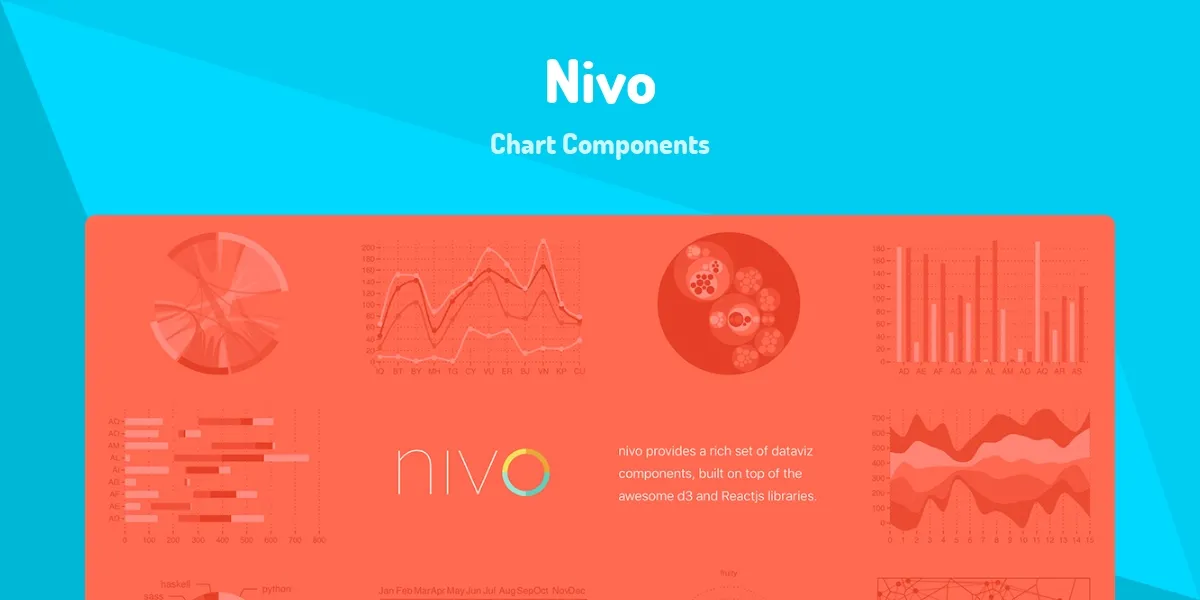
It is another best react native chart libraries in the collection. The ability of server-side rendering of nivo makes it unique in comparison to other libraries. The Nivo library provides templates for useful graphs and charts. It has immense flexibility in providing HTML, Canvas charts, and SVG in a library. It offers transitions or motion, and it contains a 7.7-star rating on GitHub. It’s a solution for responsive visualization requirements.
5. Visx
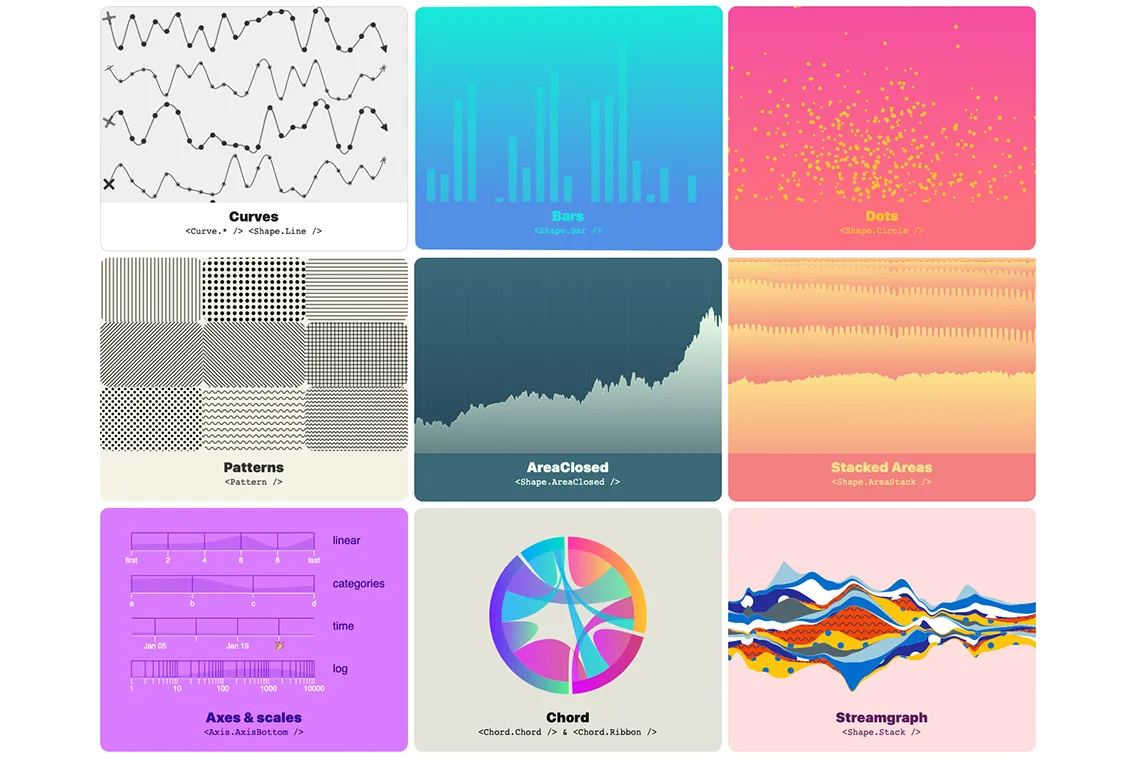
It is a component library developed by Airbnb and has an 11.3K stars rating on GitHub. Also, it combines the React DOM benefits. The React Native app development agencies or developers using this open-source tool consider it as a chart library instead of an un-opinionated reusable visualization components collection.
Read also: Most Used Third-Party API for React Native Application
6. BizCharts
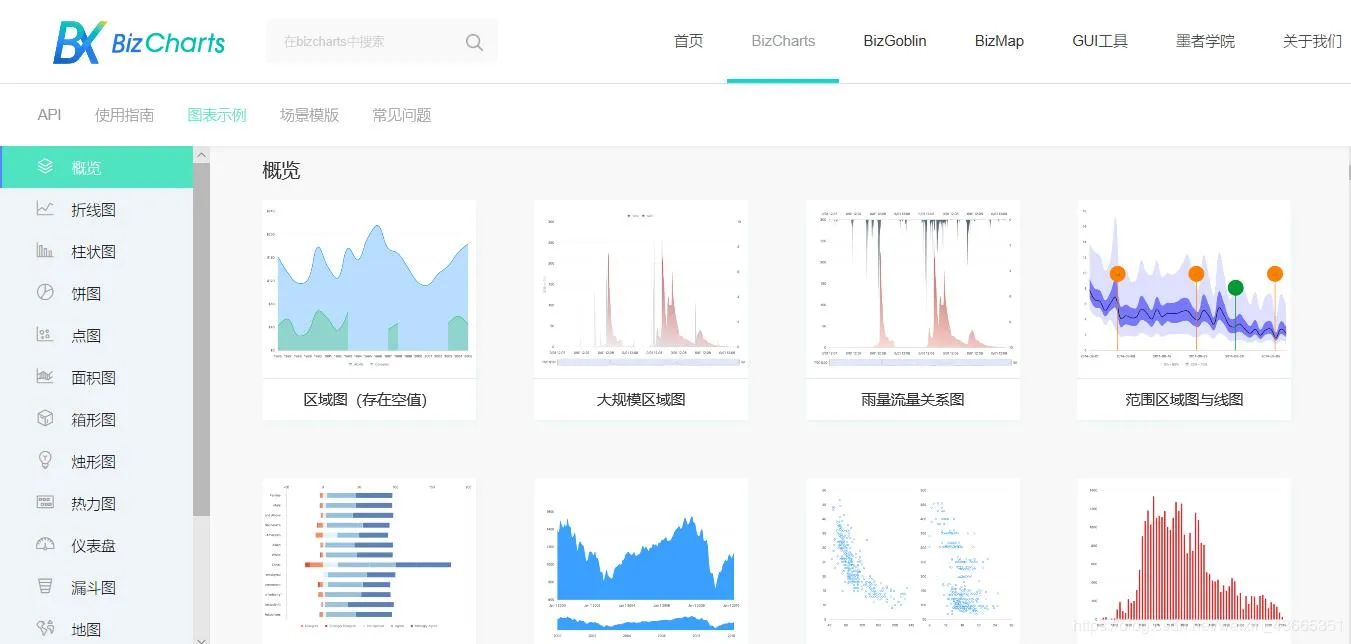
Alibaba has its React native chart library on GitHub. BizCharts provides charting for apps based on React and G2. BizCharts has ES6 syntax and is known for its popular template library. The gallery and documentation are mentioned in Chinese. The chart library, mostly Asian, has earned 5.4K stars and 27K node package manager downloads.
Must Read: Top 10 Databases to Use for React Native Mobile App Development
7. react-vis
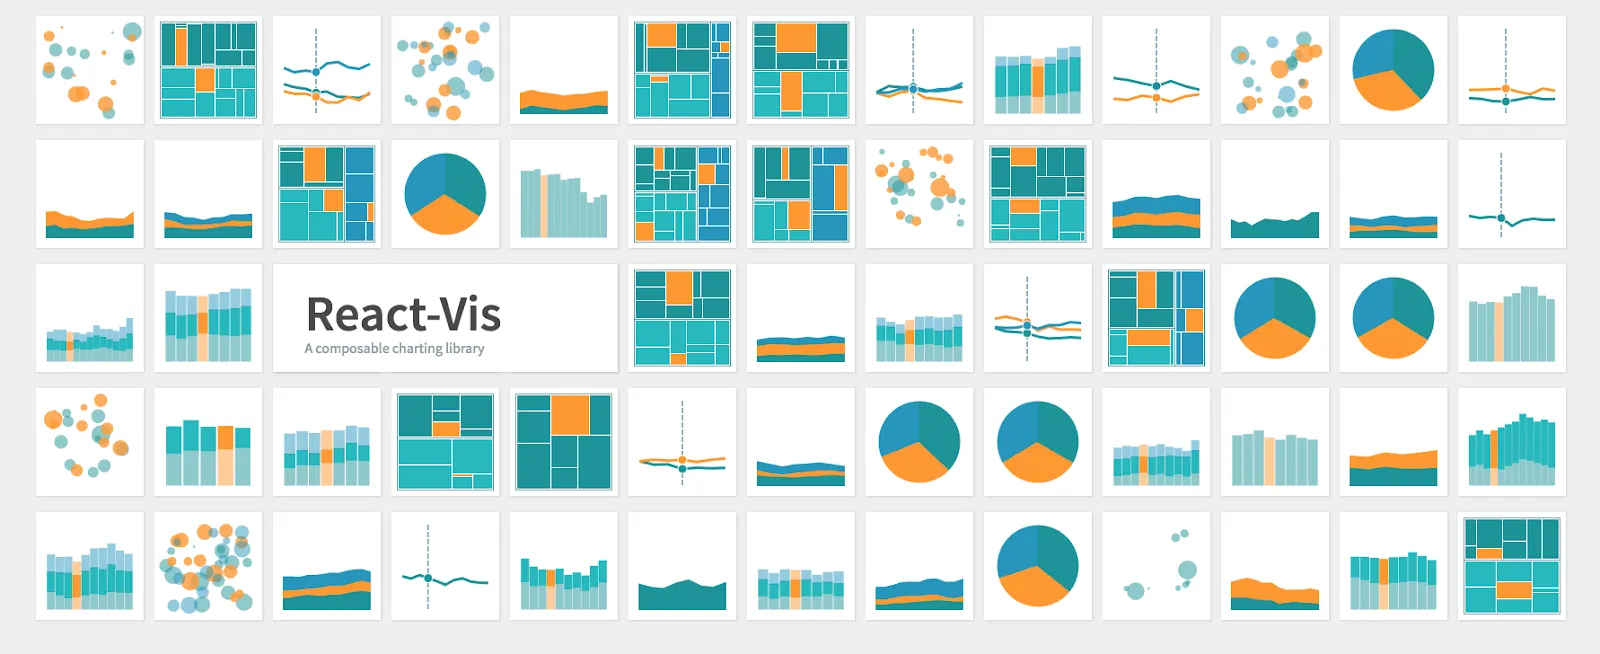
A React chart library that you can easily learn quickly is react-vis. It is a React components collection for rendering common visualization charts of data. These charts include area/line/bar charts, scatterplots, heat maps, hexagon heat maps, contour plots, donut charts, sunbursts, tree maps, and parallel coordinates. You can hire React Native developers to use these charts for better data visualization. React-vis has around 7.5K stars rating on GitHub.
8. react-stockcharts
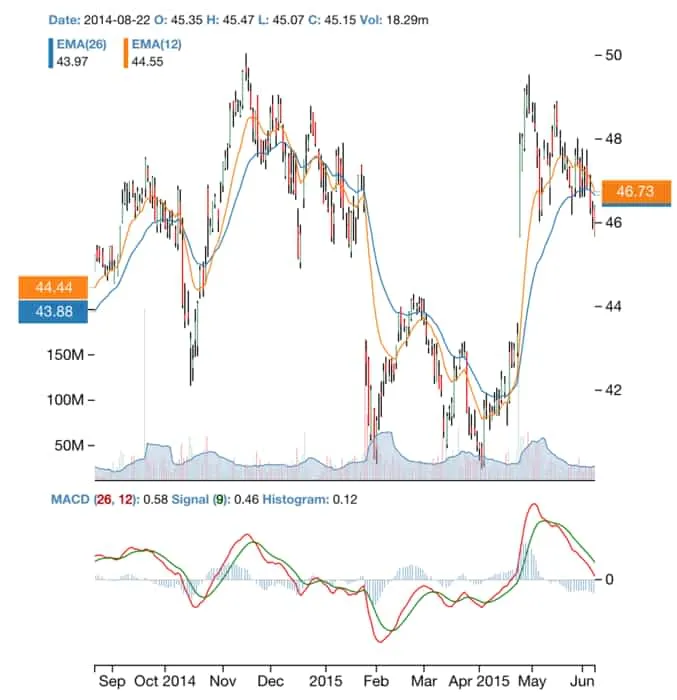
As the name shows, this library provides versatile and extensive templates for charts in the React app. The pack has more than 60 technical overlays and indicators. It is fully ready to fulfill all your data visualization requirements. This library has more than a 2.9K stars rating on GitHub and must not be updated or maintained.
9. rumble-charts
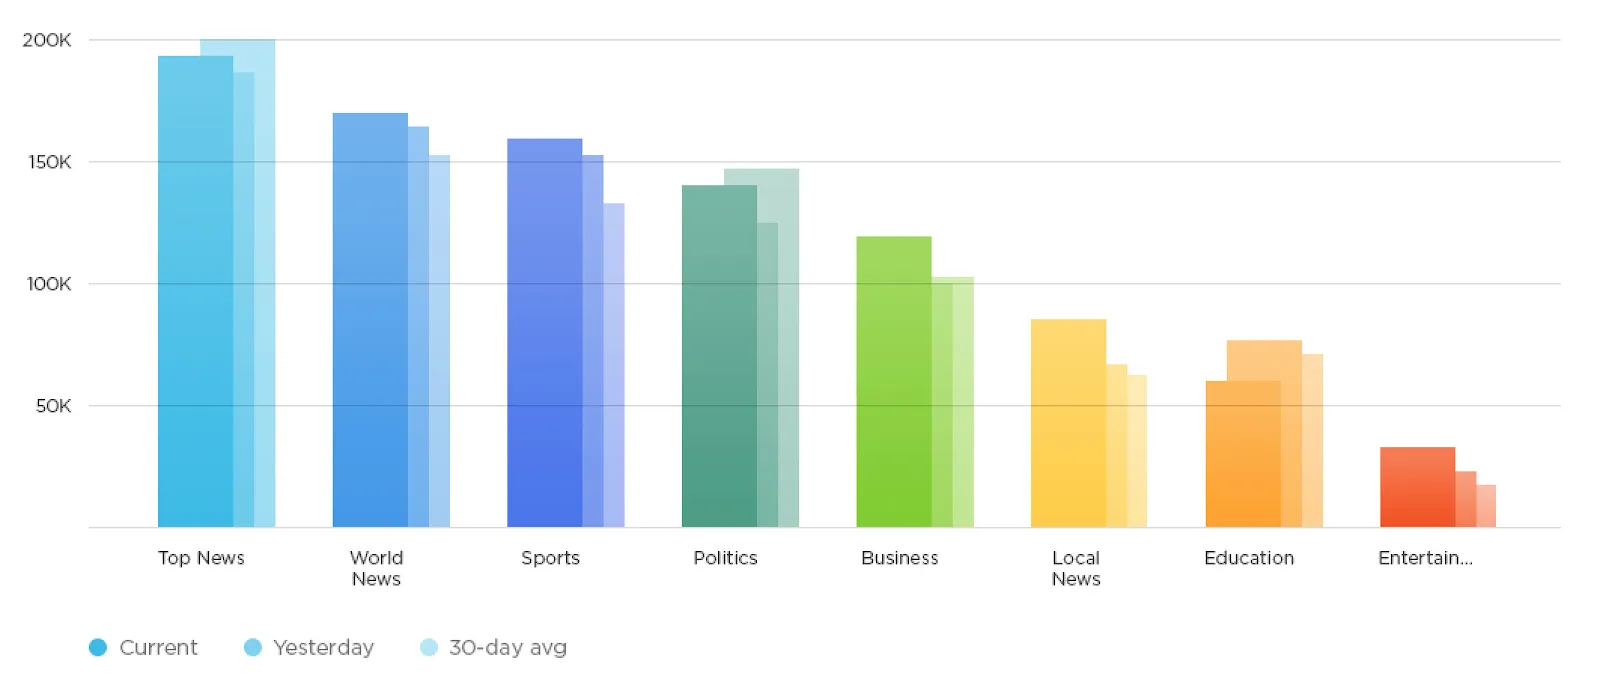
One of the modest anonymous React native charts is rumble-charts. The library developers describe it as components to create flexible and composable charts for visualizing the data. It is D3.js-based and well-updated with several new features. Also, rumble-charts fall in the example of the React native graph library for data comparison.
10. react-time-series-charts
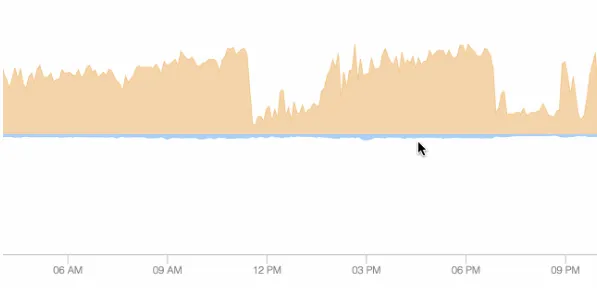
This React chart library focuses on many time series data charting components. The library includes many charting components made specifically for visualizing network traffic and time-series data on React. Low-level elements are built using d3 and React at a higher composability level. So, the library is not actively updated or maintained, but it makes it up for examples and extensive documentation.
Read also: Why MERN Stack Considered the Best for Developing Web Apps?
11. react-financial-charts
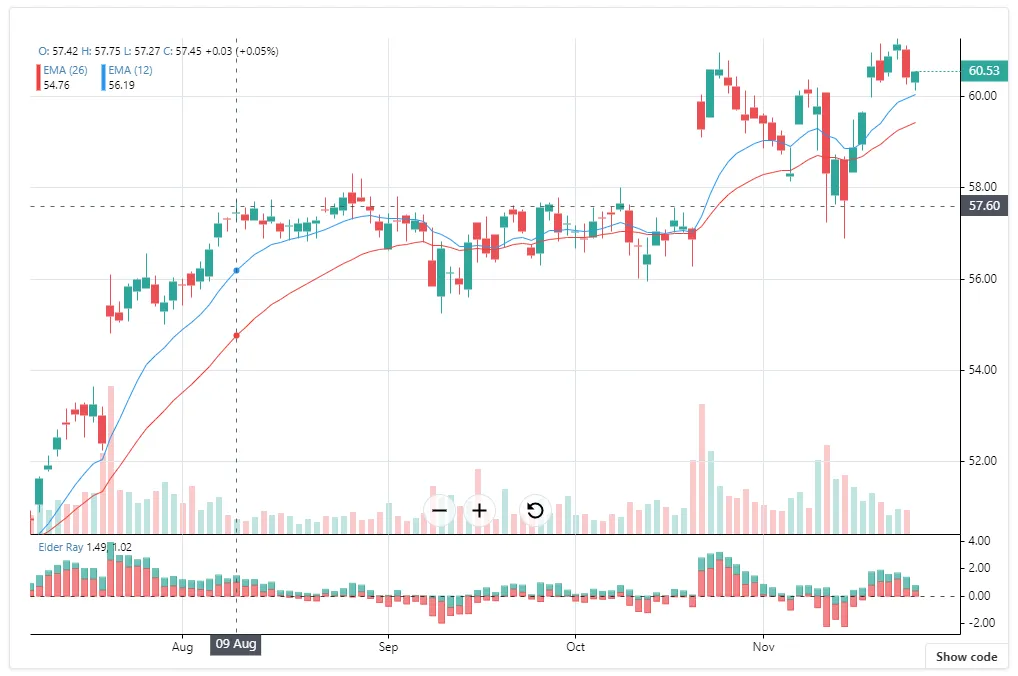
Now, the react-financial charts have emerged over the years with typescript syntax as well as bug fixes. Though it is unknown to many people, it has become one of the good alternatives to defunct react-stockcharts. It also brings weightage to the list of React native chart libraries for finance and stock trading React apps.
12. react-native-charts-wrapper
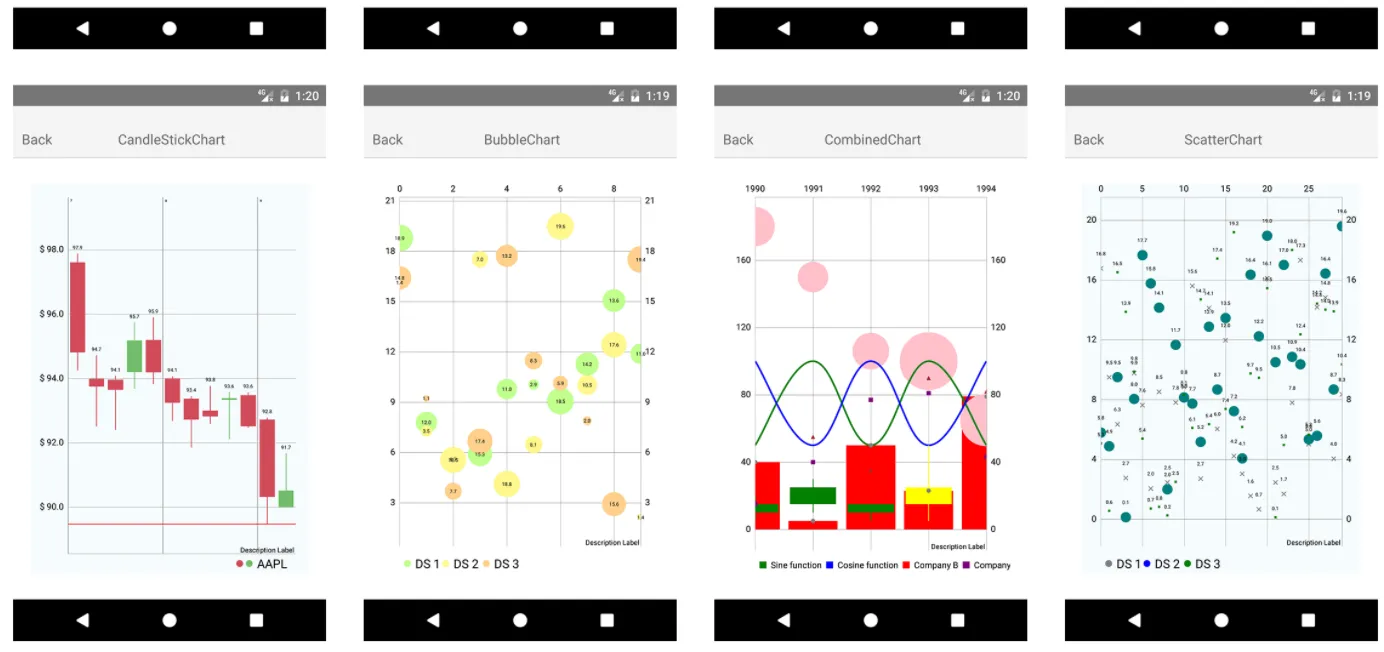
It is an open-source library supporting both Android and iOS devices. It supports configurations present in the MP Android Chart library. This has many chart types: scatter, line, pie, radar, bubble, candlestick, and combined. So, it is properly documented and integrated into React Native apps with a step-by-step guide. It is properly maintained and updated on GitHub.
Conclusion
All these open-source React native chart libraries are well-maintained and are preferred by many. The motive of the libraries is to allow you to represent data in the most accurate form. It also helps with the application development process. So, select a library that suits all your requirements.
The best and most appropriate React native chart library will impact your application design elements extensively. If want to prevent the trouble of making decisions, you can simply hire Reactjs developers. They will analyze your project and implement the solutions accordingly.
Jatin Panchal
Jatin Panchal is the Founder & Managing Director at Rlogical Techsoft Pvt. Ltd. For more than a decade, he has been fostering the organization's growth in the IT horizons. He has always bestowed personalized approaches on .NET, PHP, Flutter, and Full-Stack web development projects. From startups to large enterprises, he has empowered them to accomplish business goals. By delivering successful industry-driven solutions, he is encouraging the capability of AI, ML, blockchain, and IoT into custom websites and hybrid mobile applications.
Related Blog
- How React Native Is The Future Of Hybrid App Development?
- Top Things To Consider When Creating A React Native App
- Steps To Follow To Debug and Release APK File in React Native
- Mobile App Development Cost Optimization With The Help Of React Native
- What are the most used Third-Party API for React Native Application?
Categories
- All
- AI Development Services
- Amazon Web Services (AWS)
- ASP.Net Development
- Azure Web App
- Big Data Analytic
- Customize
- Digital Marketing
- Drupal Development
- E-commerce web development
- Education Mobile App Development
- Enterprise Application
- Event Management App Development
- Fintech
- Fitness App Development
- Food Delievery
- Front-End Development
- Healthcare App Development
- Hire Dedicated Developers
- Hotel Booking App
- IT Industry
- JavaScript Development
- Mobile App Development
- On Demand App Development
- On Demand Healthcare App Development
- PHP Development
- POS Software Development
- Real Estate Mobile App Development
- Retail Business App Development
- Salesforce
- Social Media Development
- Software Development
- Technology
- Transportation App Development
- UI/UX Design
- Web Design
- Web Development
- Web Services
- Web/Data Scraping Services
- WordPress


 Jatin Panchal in React Native Development


